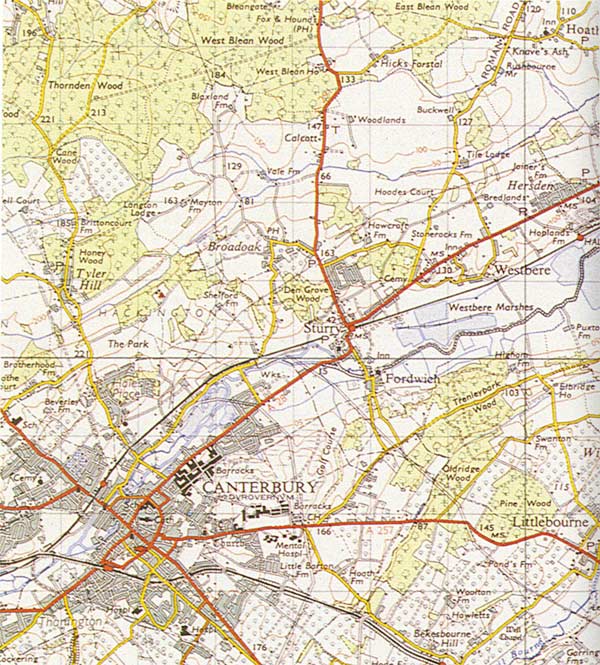
In this exhibit we turn to a modern topographical map to see how the issues we have raised so far bear up under examination. Closely examine the Ordnance Survey map (ITEM 6.1) and the two photographs (ITEMS 6.2 and 6.3) of the landscape depicted. Consider carefully the following questions.
- How do you know ITEM 6.1 is a map?
- How do you read it? Do you need anything that is not on the map to read it?
- Why is it called an Ordnance Survey map?
- What kind of symbols does it employ? Are they purely arbitrary, symbolic, natural, iconic? Are they all explained in the key? On what kind of conventions are they dependent? Can anyone read the map or is there tacit knowledge involved?
- Is there anything indexical about the map?
- Is there anything invariant between the map and reality, that is to say non-indexical?
- Is a scale necessary? What does it enable you to do?
- Does the map contain more information than is specifically recorded by the cartographer?
- Is there any information lost?
- Does it contain all the possible information? Can there be multiple maps of the same place?
- What sort of projection is used? Are you told? What difference does it make? Are projections necessarily conventional?
- What orientation does it have? Why is north usually at the top? Does it matter?
- What are the criteria by which one evaluates a map? Are they all necessarily tied to human purposes? Does 'workability' cover them all?
- What possible uses are there for maps? Are any maps anything else as well as maps? *What does the grid enable you to do? If one of the functions of the map is to allow accurate measurements to be made, what sort of things can be measured? What social accomplishments and practices are required to enable those measurements (bench marks, sea level, National Grid datum, standard yard etc.)?
- How many of the features in the map are non-geographical, that is, constructed? How many of them depend on continuing social and political practices for their existence?
- Are any of the functions of the society, state, interest groups, military served by this, or any, map?
- What is the difference between a map and a photograph? Which is more real?
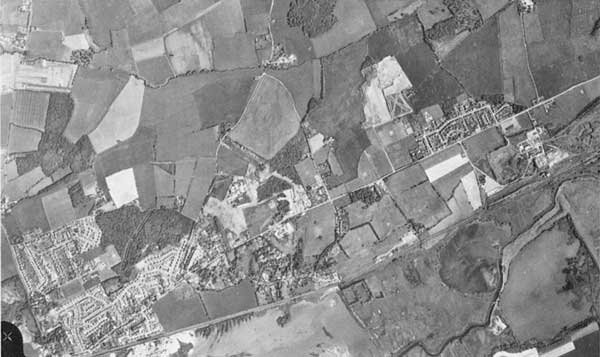
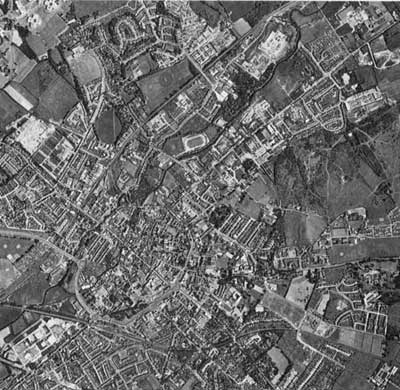
- The two aerial photographs are of the top right-hand and bottom left-hand quarters respectively. * Did you find any difficulty in matching them? What does this tell you about the representational power of the map?
- What do the photographs show that the map does not? What are the differences between them with respect to time? What is the difference in function? Why can't we replace maps with photographs?

6.1
An Ordnance survey map, scale 1:63 360, of the city of Canterbury, published in 1959.

6.2
Aerial photograph of top right quarter of ITEM 6.1, taken in 1967.

6.3
Aerial photograph of bottom left quarter of ITEM 6.1, taken in 1967, showing a new road on the west side of Canterbury.