Karl Popper argues that languages have a descriptive function which is clearly distinguishable from their argumentative function. This, according to Popper,
makes the familiar analogy between maps and scientific theories a particularly unfortunate one. Theories are essentially argumentative systems of statements: their main point is that they explain deductively. Maps are non-argumentative. Of course every theory is also descriptive, like a map.
Karl Popper, Unended quest: an intellectual autobiography, 1976, p.77)

8.1
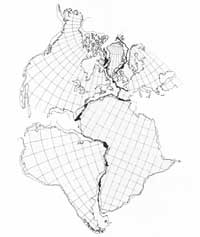
Bullard's computer reconstruction of the fit of the continents as evidence of their original connection according to Wegener's hypothesis. He used 'objective' mathematical methods to obviate the earlier criticisms of Wegener's fit. The continents are here defined by the 500 fathom contour along the edge of the continental shelves. The black shading represents overlap, and the grey shading, gaps. Latitude and longitude lines indicate present orientations of the continents.
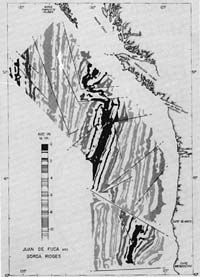
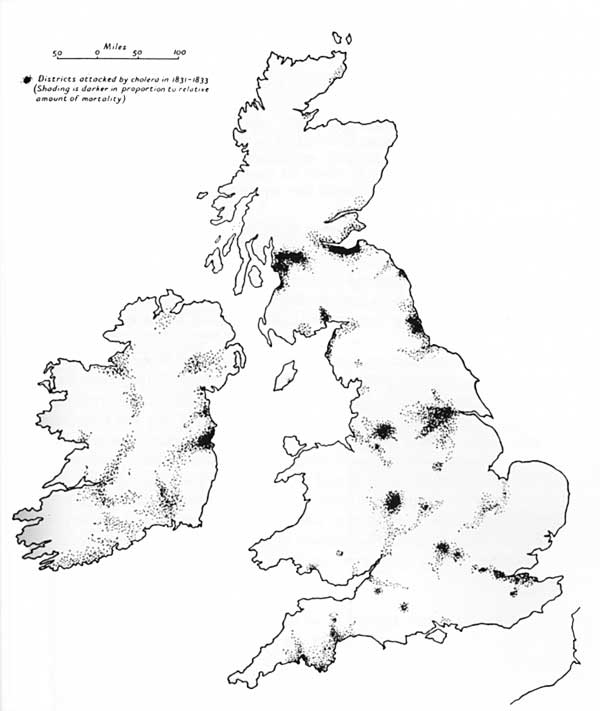
Popper may be mistaken about maps, possibly because he is concerned at this point to make a distinction between the descriptive and argumentative functions of language. Though the distinction can be sustained analytically, it cannot be pushed too far because there is a powerful sense in which descriptions are arguments. The strongest sense in which that is true is illustrated by maps. They invariably carry less information about the environment than is out there, since they are necessarily selective, but they also frequently carry more information than was actually recorded. Some maps, like those used for navigation, can have data plotted on them and deductions as to position and distance to destinations made from them. But the example of Wegener's theory of continental drift (see ITEM 8.1) and the cholera map (ITEM 8.2), show that new knowledge can be gained from a map in a profound and significant way. It was Wegener's 'fitting' of the continents that led him to hypothesise the original joining of South Africa and South America. It is interesting that, while Wegener used that 'fit' as evidence for his theory, his opponents were able to reverse the argument and criticise his theory on the grounds that map-fining did not constitute evidence and that the apparent fit was the result of selective distortion. Mapping the outbreaks of cholera also revealed a distribution that could not have been simply read from the data. Moreover maps are not always mere re-presentations of data. In ITEM 8.3 the magnetic stripes in rocks on the sea floor off the coast of West Canada become in their turn evidence of the phenomena of sea-floor spreading from ocean ridges, the ultimate proof of Wegener's theory. Indeed ordering information spatially provides a very powerful mode of inference to new knowledge that is ignored by Popper.

8.3
The mapping of the magnetism of rocks beneath the sea reveals mirror image patterning on either side of the central ridge, which is graphic evidence of molten rock flowing out from the ridge and thereby accounting for sea-floor spreading off West Canada.
However, there is an even deeper sense in which maps are like theories in that they are 'argumentative systems of statements'. That is the sense in which they embody or express a cognitive schema. As has been discussed in Imagining nature, observation statements are not clearly separable from theoretical statements, and theoretical statements in turn embody sets of assumptions about how reality is ordered. This whole complex of unconscious assumptions about the ordering of reality which structures our experience of it can be thought of as a cognitive schema. In the case of maps, the idea that our ability to understand the world is dependent on modes of ordering of which we are at best only partially aware is of particular interest. As concrete examples they provide an opportunity for bringing such cognitive schemas to the fore, and they also provide an opportunity to explore the claim that in the deepest possible way knowledge is inherently spatial, and embedded in practical action.

8.2
A 20th-century redrawing of Augustus Petermann's map of 1852, displaying the spatial impact of the cholera outbreak of 1831-33.